10 Best Content Analytics Software for Better ROI in 2026

Best Content Analytics Software Shortlist


Content analytics software helps you track, measure, and interpret how your digital content performs so you can make smarter decisions and justify your strategy. If you’re searching for ways to understand your audience, prove content ROI, or spot trends that drive growth, you need software that does more than count visits.
I’ll break down the strengths and specialties of the top options so you can find the right fit—whether your goal is deeper audience insight, channel-by-channel performance, or actionable SEO data. Here’s what you need to know to choose the right platform for your 2026 content goals.
Best Content Analytics Software Summary
This comparison chart summarizes pricing details for my top content analytics software to help you find the best one for your budget and business needs.
| Tool | Best For | Trial Info | Price | ||
|---|---|---|---|---|---|
| 1 | Best for analyzing SEO and keyword content performance | Free plan + 7-day free trial + free demo | From $117.33/month (billed annually) | Website | |
| 2 | Best for tracking user journeys across web properties | Free plan available | Pricing upon request | Website | |
| 3 | Best for optimizing content with AI-driven insights | Free plan available | Pricing upon request | Website | |
| 4 | Best for automated data collection from multiple channels | Free demo available | From $200/month (billed annually) | Website | |
| 5 | Best for qualitative data coding and visualization | 14-day free trial | Pricing upon request | Website | |
| 6 | Best for monitoring and comparing search rankings | 7-day free trial | From $79/month (billed annually) | Website | |
| 7 | Best for cohort-based behavioral analysis | 7-day free trial + free demo available | From $99/month | Website | |
| 8 | Best for integrated analytics on WordPress sites | 14-day free trial | From $40/user/month (billed annually) | Website | |
| 9 | Best for unifying marketing and CRM reporting | 28-day free trial | From $45/month (billed annually) | Website | |
| 10 | Best for mapping B2B customer journeys | Free plan + free demo available | Pricing upon request | Website |
Best Content Analytics Software Reviews
Below are my detailed summaries of the best content analytics software that made it onto my shortlist. My reviews offer a detailed look at the features, best use cases, and integrations of each platform to help you find the best one for you.
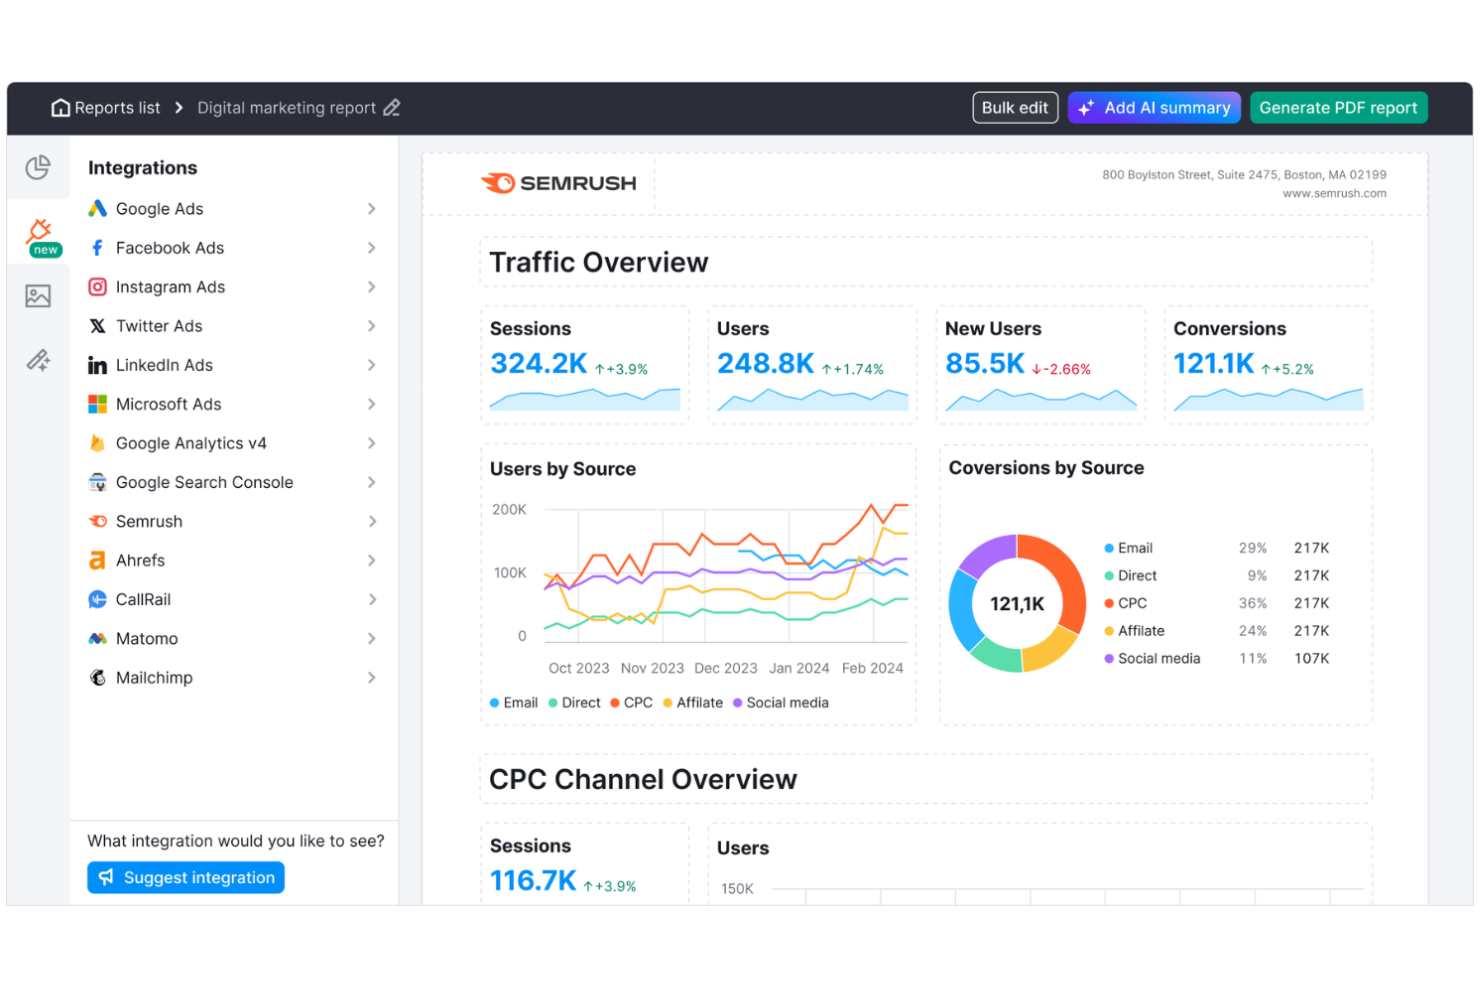
Semrush is an SEO and digital marketing platform with tools for keyword research, rank tracking, competitive analysis, content auditing, and on-page optimization across organic and paid channels.
Who Is Semrush Best For?
Semrush is a strong fit for SEO specialists, content marketers, and digital marketing teams who need to track and grow organic search performance.
Why I Picked Semrush
Semrush earns its spot as one of the best on my shortlist because no other tool connects keyword-level data to content performance as directly. I use the Position Tracking tool to see exactly which articles rank for which keywords and how those positions shift over time.
The Content Audit feature crawls your existing pages and flags underperforming content by combining traffic data with on-page SEO signals, so I can prioritize updates by actual ranking impact.
Semrush Key Features
- Keyword Magic Tool: Generates keyword lists from a seed term, with filters for search volume, keyword difficulty, and intent.
- Topic Research: Surfaces trending subtopics, headlines, and related questions around any subject to support content planning.
- SEO Writing Assistant: Scores content drafts in real time against top-ranking pages for readability, tone, and keyword usage.
- Organic Research: Shows which keywords any domain ranks for, along with estimated traffic and ranking URL.
Semrush Integrations
Semrush offers native integrations with Google Analytics, Google Search Console, Google Ads, Google Sheets, Looker Studio, Trello, WordPress, monday.com, Wix, and Zoho Analytics, along with partner integrations for content and reporting tools like AIOSEO, Yoast, and Whatagraph. It connects with Zapier and provides an API for custom integrations.
Pros and Cons
Pros:
- Built-in content scoring against top-ranking pages
- Deep keyword-to-page performance mapping
- Tracks content visibility in AI search results
Cons:
- Content marketing tools locked behind higher plans
- Traffic estimates can differ from actual analytics
Best for tracking user journeys across web properties

Google Analytics is a web analytics platform by Google that tracks user behavior, traffic sources, site engagement, and conversion events across websites and apps.
Who Is Google Analytics Best For?
Google Analytics is a strong fit for marketing teams and web managers at small to enterprise-level businesses who need detailed website traffic and audience data.
Why I Picked Google Analytics
I picked Google Analytics as one of the best because its Path exploration report lets me visualize exactly how users move through a site, step by step, across multiple pages and events. What I find particularly useful is the cross-domain measurement feature, which stitches user activity across multiple domains into a single session, preventing inflated user counts, broken attribution, and fragmented customer journeys.
For teams managing a marketing site alongside a separate checkout or product domain, cross-domain measurement allows activity to be accurately attributed to a single user as they cross domains.
Google Analytics Key Features
- Audience segments: Create custom segments based on demographics, behaviors, or traffic sources to compare how different user groups engage with your content.
- Real-time reporting: Monitor active users, page views, and live event data as they occur on your site.
- Custom event tracking: Track specific interactions like button clicks, video plays, or scroll depth across your content.
- Funnel exploration: Visualize multi-step conversion paths and identify where users drop off before completing a goal.
Google Analytics Integrations
Google Analytics offers native product links with Google Ads, Google Search Console, BigQuery, Google Merchant Center, Display & Video 360, Search Ads 360, and Google AdSense. Beyond the Google ecosystem, it integrates with CMS platforms like Shopify, WordPress, HubSpot, Wix, Squarespace, and Drupal through built-in tag support. An API is available for custom integrations, and it connects with Zapier.
Pros and Cons
Pros:
- Cross-platform web and app data unification
- No custom code needed for core tracking
- Free BigQuery export for raw data queries
Cons:
- Data retention maxes out at 14 months
- Data thresholds hide small segment insights
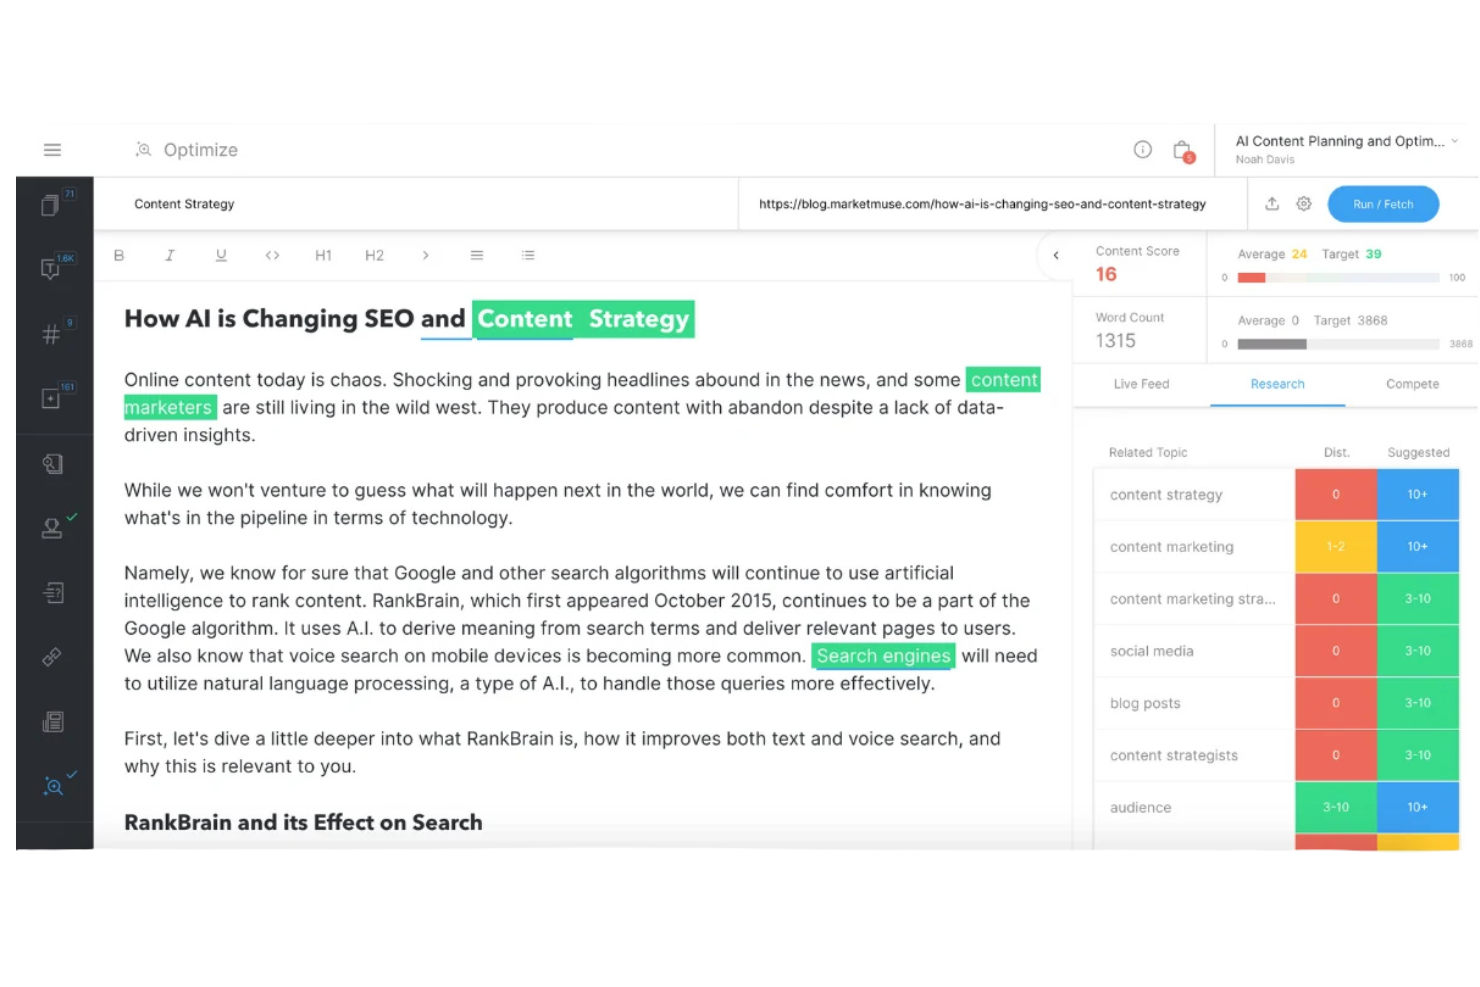
MarketMuse is an AI-powered content intelligence platform that analyzes topic authority, content quality scores, and competitive content gaps to help teams plan and optimize their content strategy.
Who Is MarketMuse Best For?
MarketMuse is a strong fit for content strategists and SEO teams at mid-size to enterprise companies managing large content libraries across competitive topics.
Why I Picked MarketMuse
I picked MarketMuse as one of the best because its personalized difficulty scoring is something I haven't seen done this well elsewhere. Unlike generic keyword difficulty scores, it measures how hard a topic is to rank for based on your specific domain's existing authority.
I also rely on its automated content inventory, which continuously tracks content decay and ranking changes without any manual crawling. Together, those two features make content prioritization feel genuinely data-driven rather than intuitive.
MarketMuse Key Features
- Heatmap competitive analysis: Visualizes topic coverage gaps across the top 20 SERP results using a color-coded grid you can sort and export.
- Content briefs: Generates research-backed content outlines with topic models, related questions, and linking suggestions tailored by content type.
- Content score: Measures topical depth and quality of a page before publication, with a real-time score that updates as you write.
- Content plan documents: Produces a structured content plan that outlines what to create or update, grouped by topic clusters and competitive opportunity.
MarketMuse Integrations
MarketMuse offers a smaller set of integrations, including Google Docs exports and an Acrolinx integration. An API is available for custom integrations, but Zapier support is not clearly documented.
Pros and Cons
Pros:
- Automated cluster analysis reduces manual content audits
- Personalized difficulty scores reflect your domain's authority
- Topic modeling uncovers missed subtopics automatically
Cons:
- Non-English queries return limited data
- Advanced features locked behind premium plans
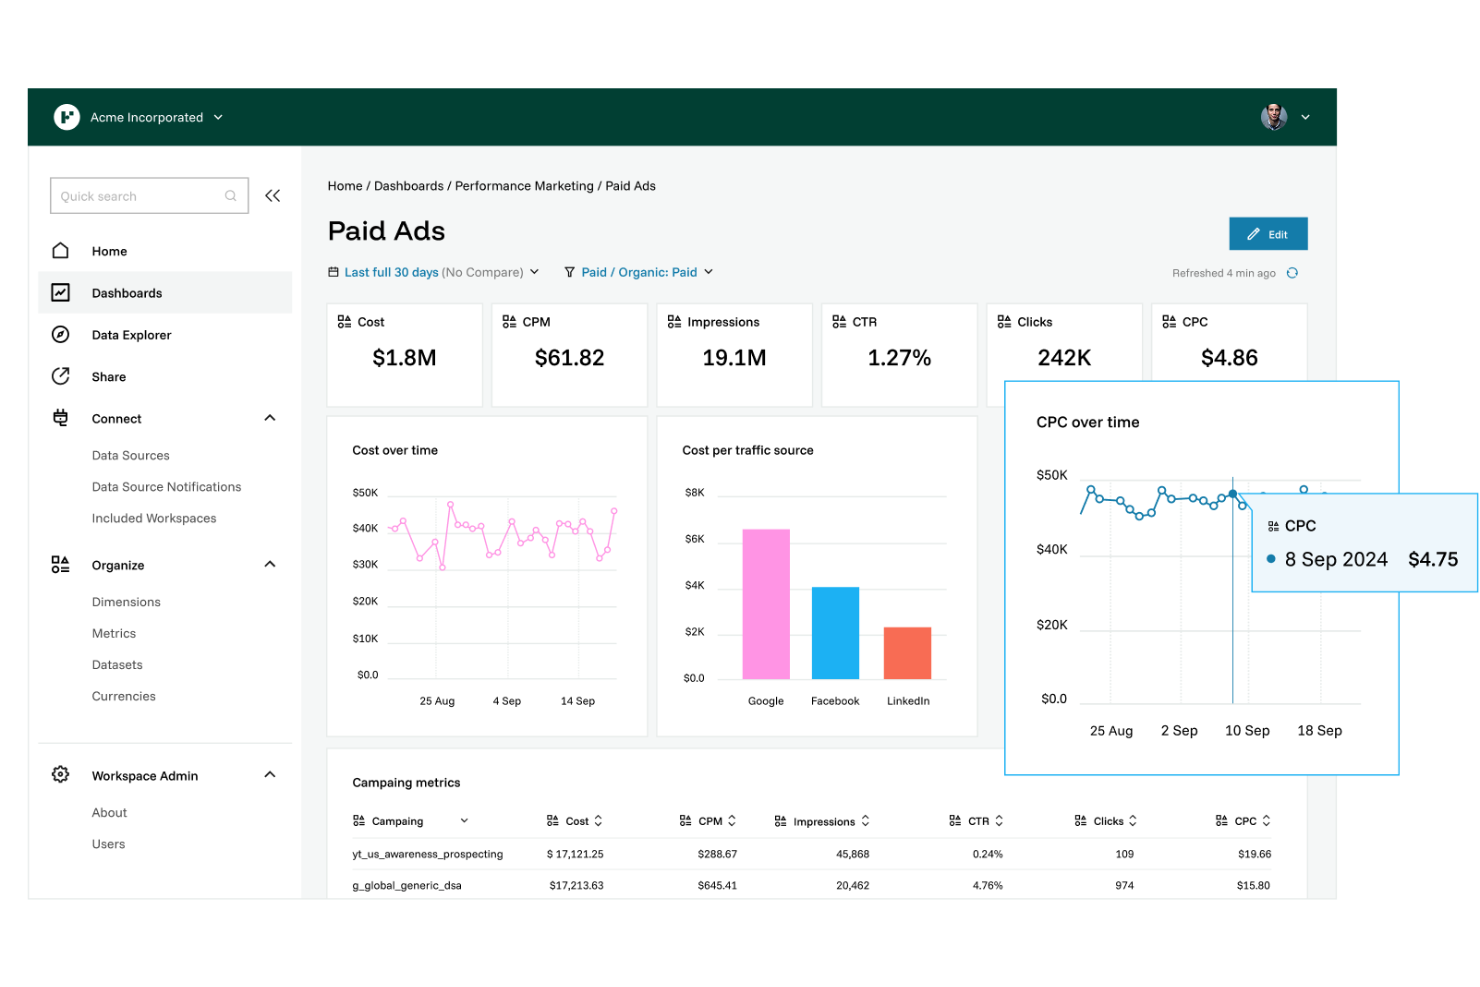
Funnel is a marketing intelligence platform that centralizes data from 600+ ad and analytics sources, with built-in multi-touch attribution, marketing mix modeling, and automated cross-channel reporting.
Who Is Funnel Best For?
Funnel is a strong fit for performance marketing teams at mid-market to enterprise companies running paid campaigns across multiple ad platforms simultaneously.
Why I Picked Funnel
I picked Funnel as one of the best because its automated data collection eliminates the manual CSV exports and copy-paste work that slow down reporting across paid channels. Funnel pulls raw, unadjusted data directly from 600+ connectors, including Google Ads, Meta, TikTok, and LinkedIn, and maps it into a shared data model automatically.
I also rely on its data transformation layer to rename, merge, and reclassify fields without writing SQL, which keeps our cross-channel reports consistent week over week.
Funnel Key Features
- Multi-touch attribution (MTA): Track every digital touchpoint in the customer journey across paid and organic channels with unbiased, data-driven attribution.
- Marketing mix modeling (MMM): Run daily-updated MMM that accounts for seasonality, adstock effects, and external factors to separate genuine channel impact from baseline performance.
- Scenario planner: Model budget allocation scenarios using saturation curves and marginal ROAS data to forecast outcomes before shifting spend.
- Data destinations: Push governed marketing data to 40+ destinations, including Snowflake, BigQuery, Tableau, Looker, and Power BI.
Funnel Integrations
Funnel connects to 635 data source connectors, including Google Ads, Google Analytics, Facebook Ads, TikTok Ads, LinkedIn, Microsoft Advertising, Pinterest, and Instagram Insights, and sends data to 44 destinations such as Google Sheets, Looker Studio, Tableau, Microsoft Power BI, and BigQuery.
Pros and Cons
Pros:
- Cross-channel data blending in one hub
- No-code data transformation and field mapping
- 635+ native connectors for marketing data
Cons:
- Flexpoint pricing scales unpredictably with usage
- Native dashboards lack visualization depth

MAXQDA is a computer-assisted qualitative data analysis (CAQDAS) platform for coding, analyzing, and visualizing unstructured data across text, audio, video, PDFs, survey responses, and social media content, with built-in support for mixed methods research.
Who Is MAXQDA Best For?
MAXQDA is a natural fit for academic researchers, UX teams, and social scientists who work with large volumes of qualitative data like interviews, focus groups, or open-ended survey responses.
Why I Picked MAXQDA
MAXQDA earns its spot as one of the best on my shortlist because of how tightly its coding and visualization tools are built around qualitative workflows. I rely on its Code Matrix Browser and Document Portrait to see exactly how codes distribute across a document set, which makes pattern recognition in large interview datasets genuinely fast.
The MAXMaps concept mapping tool lets me draw and annotate connections between codes visually, something most content analytics tools don't offer natively.
MAXQDA Key Features
- AI Assist: Automatically paraphrases documents, suggests coded segments for a code, and generates subcode suggestions based on coded text segments.
- Auto transcription: Transcribes audio and video recordings automatically and links transcripts directly to their source media file.
- Summary grids and tables: Organize and compare summarized data points across documents using structured grid and table views.
- Smart Publisher: Generates and exports customizable research reports across multiple file formats.
MAXQDA Integrations
MAXQDA doesn't have traditional native integrations with third-party software. It does support direct data imports from SurveyMonkey and YouTube comments, and it can import bibliographic data from reference management tools like Endnote, Mendeley, Citavi, and Zotero.
Pros and Cons
Pros:
- MaxDictio adds dictionary-based content analysis
- Built-in mixed methods analysis support
- Codes text, audio, video, and images natively
Cons:
- No cloud-based real-time collaboration option
- Auto-transcription speaker detection is unreliable
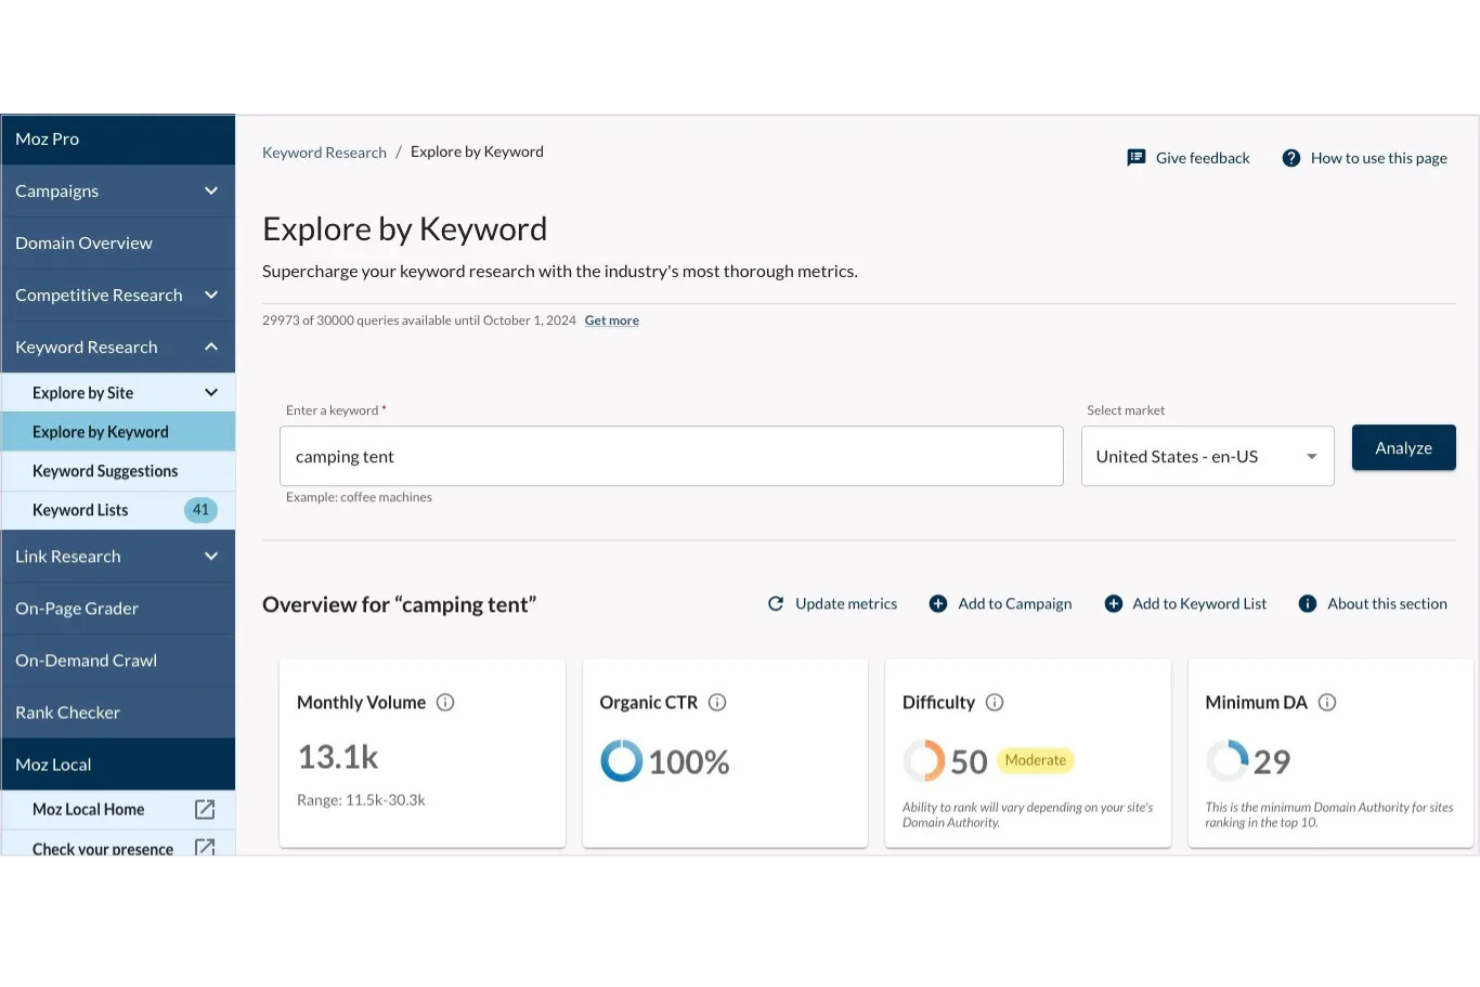
Moz is an SEO analytics platform built around rank tracking, keyword research, backlink analysis, and site auditing, with proprietary metrics like Domain Authority and Page Authority.
Who Is Moz Best For?
Moz is a strong fit for in-house SEO teams and content marketers who need to track rankings and benchmark performance against competitors.
Why I Picked Moz
I've included Moz in my top picks because its Rank Tracker lets me monitor keyword positions across locations and devices, then compare them directly against competitor domains in the same view. I also rely on its SERP feature tracking to see when competitors are winning featured snippets or local packs for keywords I'm targeting.
That side-by-side visibility into ranking shifts is what makes Moz stand out for competitive search analysis.
Moz Key Features
- Keyword Explorer: Generates keyword suggestions with search volume, difficulty scores, and organic CTR estimates to prioritize content targeting.
- Site crawl: Scans your site for technical SEO issues like broken links, duplicate content, and missing metadata, organized by priority.
- Link Explorer: Shows your backlink profile, including linking domains, anchor text, and Domain Authority scores for each source.
- On-Page Grader: Scores individual pages against a target keyword and surfaces specific on-page optimization recommendations.
Moz Integrations
Moz offers native integrations with Google Analytics 4, Google Search Console, and Looker Studio, and provides a pre-built Looker Studio connector for custom reporting.
Pros and Cons
Pros:
- Proprietary Brand Authority tracks brand signals
- Keyword difficulty scores are highly accurate
- Domain Authority is an industry-standard metric
Cons:
- Rank data refreshes on a weekly cycle
- Keyword database is smaller than competitors
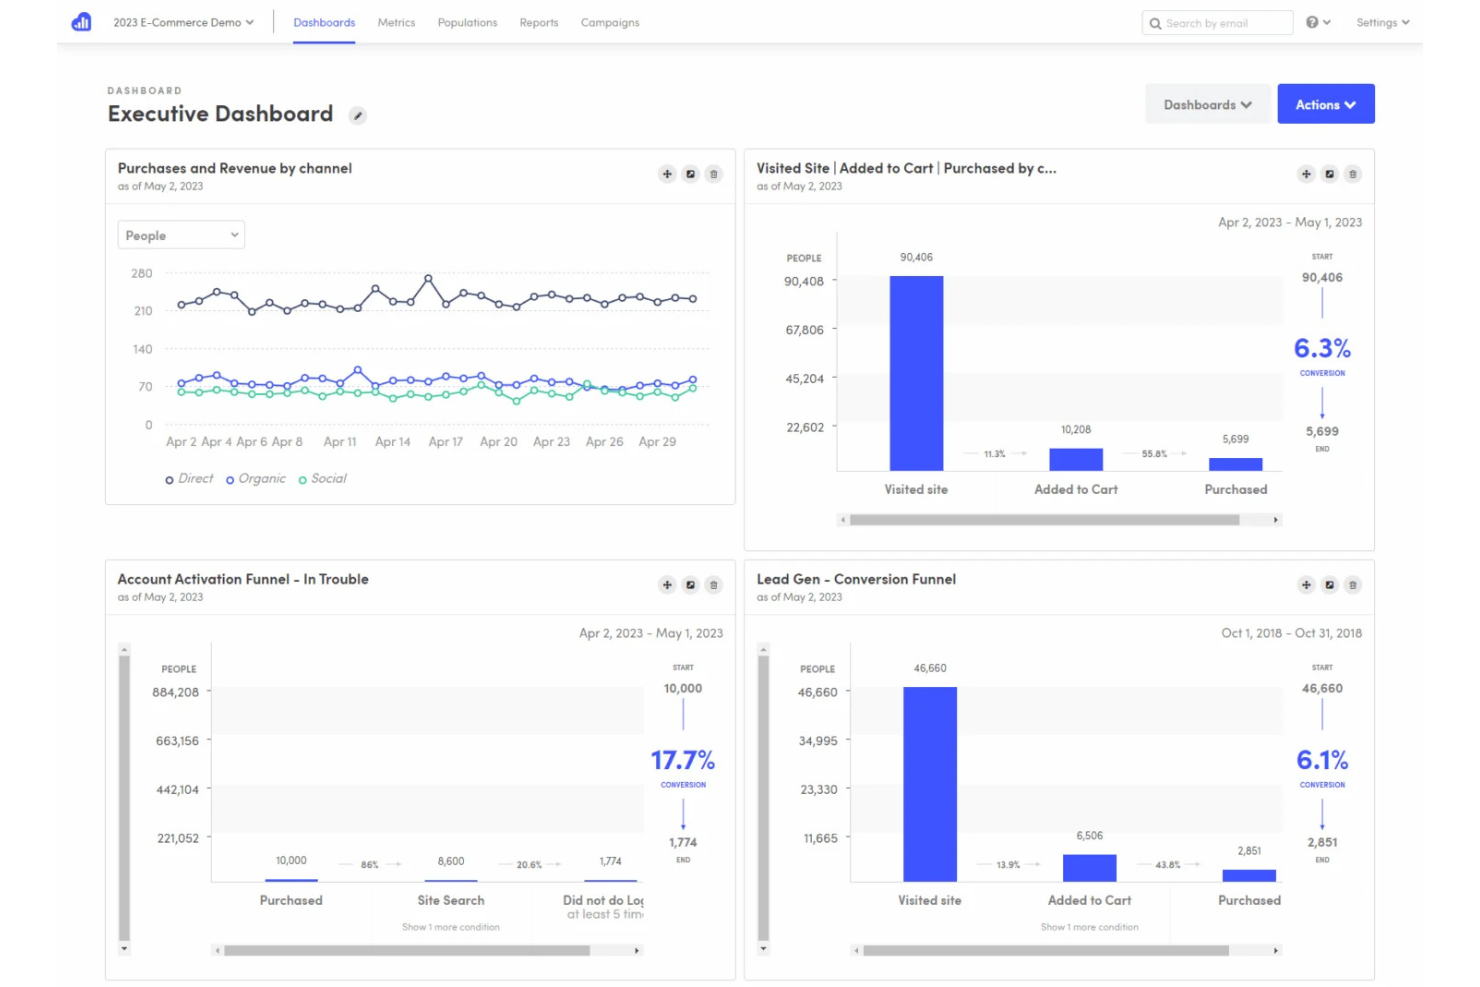
Kissmetrics is a behavioral analytics platform that tracks individual user actions across the entire customer lifecycle, from acquisition through retention, with funnel analysis, cohort reports, and person-level event tracking at its core.
Who Is Kissmetrics Best For?
Kissmetrics is a strong fit for product and growth teams at SaaS companies who need to track how individual users behave across the full customer lifecycle.
Why I Picked Kissmetrics
I picked Kissmetrics as one of the best because its cohort report goes deeper than a standard retention grid. You can group users by any initial event, not just signup, and track progression to any subsequent event with configurable daily, weekly, or monthly bucket sizes.
I also find the drill-down capability genuinely useful: clicking into any cell shows you the exact users behind that retention number, so you can act on the data rather than just observe it.
Kissmetrics Key Features
- Funnel reports: Map a sequence of up to 10 events and see where users drop off, with filters to isolate any user segment within the funnel.
- Populations: Build dynamic user segments based on behavioral events, properties, or any custom criteria that update automatically as users qualify.
- Metrics dashboard: Monitor core KPIs in real-time from a single dashboard, with the ability to drill into individual numbers as they update.
- Behavioral email campaigns: Trigger automated email sequences based on specific user actions, such as inactivity, feature usage, or conversion events.
Kissmetrics Integrations
Kissmetrics offers 30+ native integrations, including Salesforce, HubSpot, Mailchimp, Shopify, WooCommerce, Magento, Optimizely, CallRail, Segment, and Google Tag Manager. A REST API is available for custom integrations.
Pros and Cons
Pros:
- Ties ad spend directly to revenue attribution
- Visual cohort grids show retention with color coding
- Reports center on individual people, not aggregates
Cons:
- Limited built-in dashboard customization options
- Complex initial setup for event-heavy sites
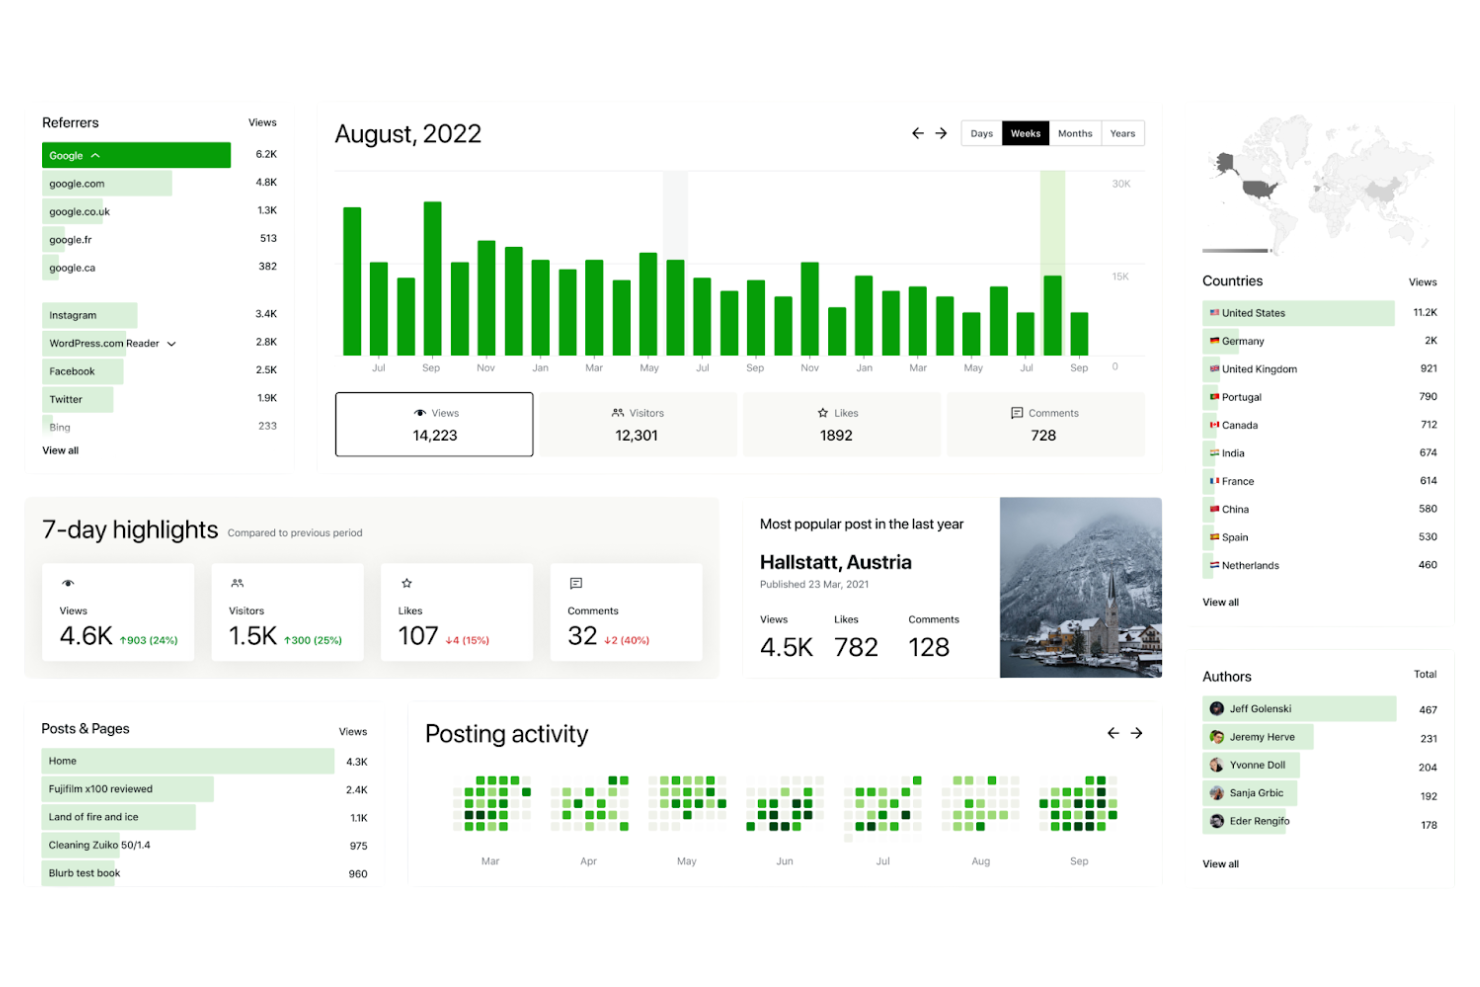
Jetpack is a WordPress plugin suite that combines site security, performance tools, and traffic analytics, including visitor stats, top posts, and referral source tracking, all surfaced directly inside the WordPress dashboard.
Who Is Jetpack Best For?
Jetpack is a natural fit for WordPress site owners, bloggers, and small content teams who want analytics without leaving the WordPress admin.
Why I Picked Jetpack
I picked Jetpack as one of the best because it's the only content analytics tool that lives entirely inside your WordPress admin. You don't need to leave your dashboard to see top posts, referral sources, or UTM-tracked traffic.
I also like the author metrics feature, which shows which team members are producing your highest-traffic content. For WooCommerce sites, you get order and product trend data layered directly into the same stats view.
Jetpack Key Features
- Geo-based visitor tracking: See a heatmap of where in the world your site visitors are coming from, broken down by country.
- Subscriber stats: View your WordPress and email subscriber counts and track which social networks your content is being shared to most.
- Link click and file download tracking: Measure clicks on links, video plays, and file downloads directly within your site stats.
- CSV data export: Download your stats data as a CSV file from any stats feature for offline reporting or further analysis.
Jetpack Integrations
Jetpack is built specifically for WordPress and connects natively with WooCommerce, Blaze, and Akismet within the WordPress ecosystem. Its Jetpack Social feature connects to Facebook, Instagram, Threads, Bluesky, LinkedIn, Mastodon, Nextdoor, and Tumblr for auto-sharing content.
Pros and Cons
Pros:
- Free tier covers basic content analytics
- GDPR-compliant visitor tracking built in
- Stats display directly inside WordPress dashboard
Cons:
- Requires a WordPress.com account connection
- Limited analytics depth compared to standalone tools
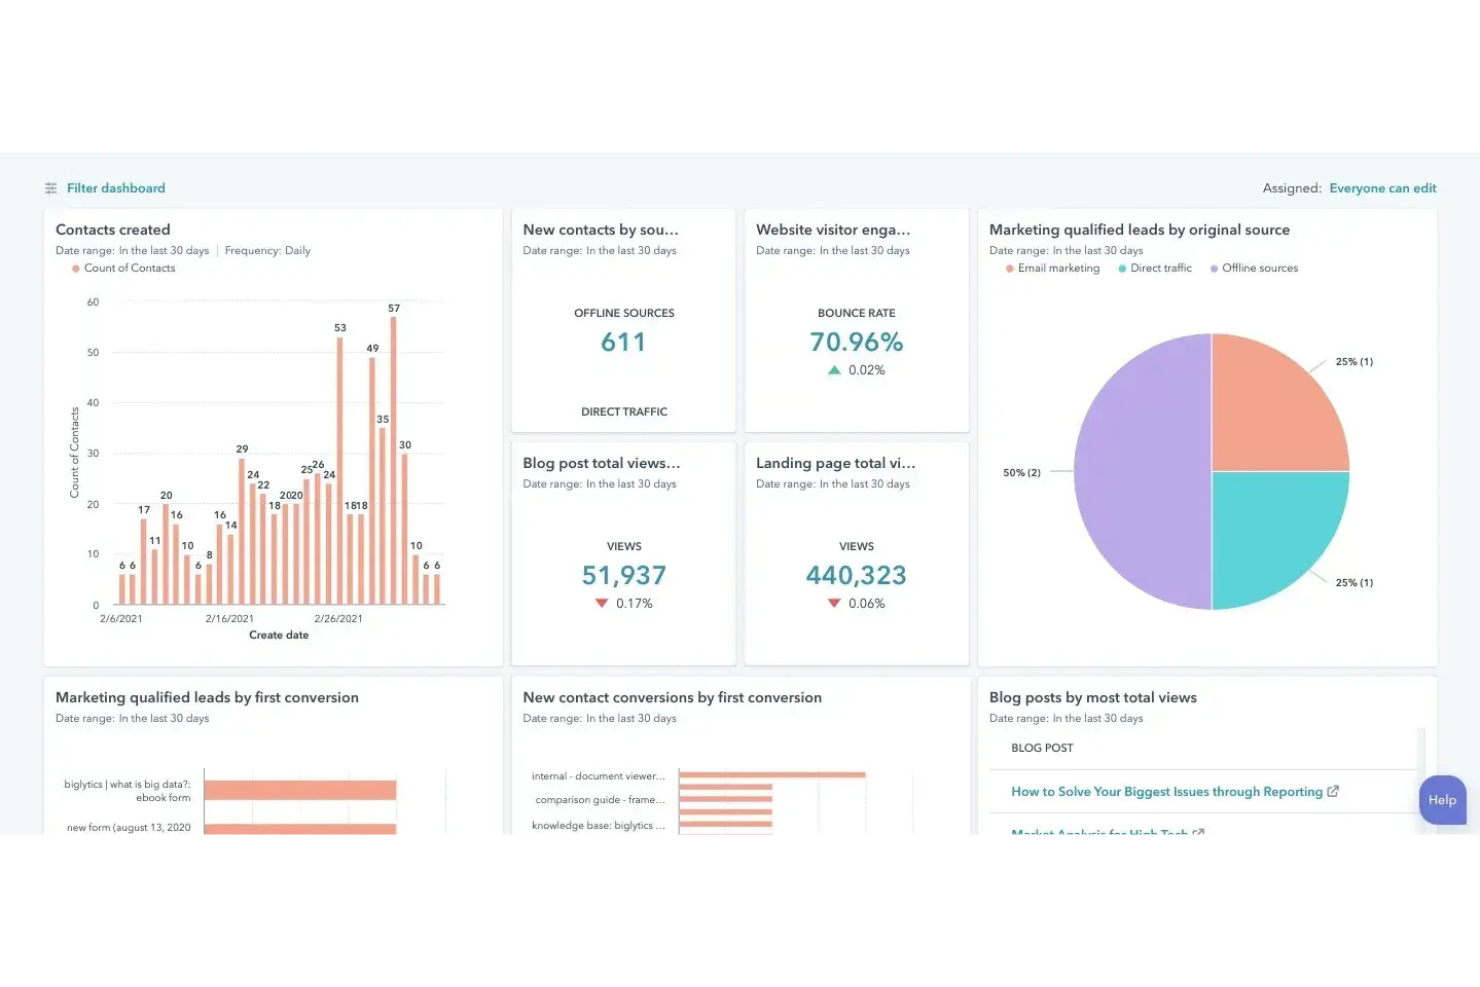
HubSpot Marketing is a marketing analytics and automation platform that combines campaign tracking, email performance reporting, lead attribution, and contact-level engagement data within a built-in CRM.
Who Is HubSpot Marketing Best For?
HubSpot Marketing is a strong fit for B2B marketing teams at small to mid-sized companies that manage both campaign execution and contact-level reporting in one platform.
Why I Picked HubSpot Marketing
I picked HubSpot Marketing as one of the best because its multi-touch revenue attribution reports tie specific campaigns directly to closed deals in the CRM. I use the custom report builder to pull marketing engagement data alongside contact properties and deal stages in a single view.
That means I can see which emails or landing pages influenced a pipeline opportunity without switching between tools.
HubSpot Marketing Key Features
- Traffic analytics by source: Break down website sessions, contacts, and leads by channel, including organic search, social, email, and paid.
- Campaign reporting: Group assets like emails, landing pages, and ads under a single campaign to measure combined performance.
- A/B testing: Run split tests on emails and landing pages to compare open rates, clicks, and conversions.
- Contact timeline: View a chronological log of every interaction a contact has had with your marketing content.
HubSpot Marketing Integrations
HubSpot's App Marketplace has grown fast, with over 1,500 integrations available across categories, including tools like Google Sheets, Google Analytics, and LinkedIn Sales Navigator, as well as Google Workspace, Slack, Zoom, and Stripe, Mailchimp, LinkedIn Ads, and Calendly, and Salesforce. It also connects with Zapier and provides an API for custom integrations.
Pros and Cons
Pros:
- CRM contact data enriches every report
- Topic cluster analytics for SEO content
- Built-in multi-touch revenue attribution reporting
Cons:
- Reports refresh on a 40-minute delay
- Custom attribution requires Enterprise tier only

Dreamdata is a B2B revenue attribution platform with a dedicated content analytics module that tracks how content across channels, from blog posts to help docs to G2, contributes to pipeline stages and revenue.
Who Is Dreamdata Best For?
Dreamdata is a strong fit for B2B marketing teams at mid-market and enterprise companies who need to connect content performance to pipeline and revenue data.
Why I Picked Dreamdata
I picked Dreamdata as one of the best because it's the only content analytics tool I've found that maps every piece of content to actual pipeline stages and revenue, not just traffic or session counts. My team uses the Content Impact by Stages view to see which blog posts or help docs are moving accounts from awareness to opportunity, and how long each conversion takes.
It also tracks content performance across platforms like G2, LinkedIn, and HubSpot, so I'm not limited to on-site data.
Dreamdata Key Features
- Multi-touch attribution modeling: Apply different attribution models (first-touch, last-touch, linear, time-decay) to see how credit is distributed across touchpoints in the buying journey.
- Account-level journey timelines: Visualize every touch an account has made across channels in an interactive timeline, from first anonymous visit to closed deal.
- Offline conversion syncing: Push pipeline and deal stage data back to LinkedIn Ads and Google Ads to help ad algorithms optimize toward revenue, not just clicks.
- Cross-channel acquisition analysis: Break down traffic, contacts, accounts, and deals by channel and campaign across a custom date range in a single view.
Dreamdata Integrations
Dreamdata offers a large set of native integrations across CRM, marketing automation, ad platforms, intent data, sales tools, BI, and data warehouse categories. These include HubSpot, Salesforce, Pipedrive, Microsoft Dynamics 365, Marketo, LinkedIn Ads, Google Ads, G2, Segment, and Snowflake, along with BI destinations like Looker Studio, Tableau, and Power BI. It also connects with Zapier.
Pros and Cons
Pros:
- Multiple attribution models for comparison
- Tracks off-site content like G2 and LinkedIn
- Ties content to pipeline stages and revenue
Cons:
- Custom report options are limited
- Data collection lag delays initial insights
Other Content Analytics Software
Here are some additional content analytics software options that didn’t make it onto my shortlist, but are still worth checking out:
- Buffer
For multi-channel post scheduling
- Similarweb
For market-wide digital insight aggregation
- Hotjar
For combining heatmaps with session replays
- BuzzSumo
For tracking viral content trends across platforms
- Chartbeat
For real-time publisher engagement analytics
- SE Ranking
For AI-powered SEO data integration
- Cyfe
For all-in-one customizable dashboards
- Fathom
For privacy-first content analytics
- Clicky
For privacy-focused real-time analytics
- Parse.ly
For editorial content performance tracking
- Microsoft Clarity
For visual content behavior insights
- Oribi
For no-code event tracking
- Quintly
For cross-network social campaign benchmarking


How I Evaluate Content Analytics Software
I split my evaluation into baseline requirements—like asset-level tracking and attribution—and differentiators that separate tools built for SaaS content teams from general analytics platforms.
Core Functionality (Table Stakes For This List)
When I'm selecting tools for my list, I rank each one on a scale from 0 (does not offer the functionality) to 5 (excels in this area) for each core functionality listed below. Then, I calculate the tool's total score into a percentage. Each tool needs to achieve a minimum total score of 65% to be considered for inclusion.
- Content Performance Tracking: I check whether a tool goes beyond pageviews to capture engagement signals like scroll depth, time on page, and conversion events at the individual asset level.
- Multi-Channel Data Aggregation: A tool should pull content data from web, social, email, and search into one view so teams aren't toggling between platforms to piece together performance.
- Attribution & Conversion Reporting: I evaluate whether the tool can connect a blog post or landing page to a lead, deal, or closed revenue using single-touch or multi-touch models.
- SEO & Organic Insights: Keyword rankings and organic traffic data tied to specific URLs matter here, especially for teams optimizing existing content libraries for search.
- Audience & Engagement Analytics: I look for visitor segmentation and behavior analysis that helps content teams understand who's consuming what and where they go next.
- Custom Dashboards & Reporting: The tool should let you build and share reports tailored to different stakeholders, from weekly content performance summaries to quarterly pipeline contribution views.
Once I have a list of tools that meet this criteria, I consider what sets each platform apart.
Differentiating Factors (What Sets Vendors Apart)
Here's how I compare and contrast different vendors:
Standout Features
Content decay alerts are a major differentiator. I want to see if a tool can flag blog posts or landing pages losing traffic or rankings so your team can prioritize refreshes before performance drops further. Competitor content benchmarking matters too, since understanding share of voice and keyword overlap helps SaaS teams spot gaps in their content strategy. I also look for built-in ROI calculators that tie production costs to revenue influenced per asset, giving content leaders real data to justify budget.
Beyond Features
MarTech stack integrations are one of the first things I evaluate. A content analytics tool needs to connect to your CRM, CMS, and marketing automation platform so data flows into attribution reports without manual exports. I also consider scalability—whether a tool supports multi-domain reporting and growing content volumes as your SaaS program matures. Time-to-value matters too. I look at how quickly teams can ingest data and generate usable dashboards, including whether prebuilt SaaS-focused templates are available to speed up onboarding.
How to Choose Content Analytics Software
It’s easy to get bogged down in long feature lists and complex pricing structures. To help you stay focused as you work through your unique software selection process, here’s a checklist of factors to keep in mind:
| Factor | What to Consider |
|---|---|
| Scalability | Will the platform handle your future growth in content, users, and data volume without forcing a disruptive upgrade or migration? |
| Integrations | Does the software connect directly to your publishing, CRM, and marketing tools? Ensure it fits into your existing data ecosystem. |
| Customizability | Can dashboards, reports, and user permissions be adapted to match your internal workflows and team structures? |
| Ease of use | Will everyone on your team—from marketing to editorial—be able to quickly find and understand the information they need without training overload? |
| Implementation and onboarding | How long will it take to get up and running? Consider what’s required for data import, user setup, and initial configuration. |
| Cost | Is total spend—including add-ons, user seats, and ongoing usage—reasonable and predictable as your team and data needs grow? |
| Security safeguards | Does the platform follow up-to-date security practices like encryption, audit trails, and GDPR compliance? Ask about certifications and protocols. |
| Support availability | If something goes wrong or you need a hand, is help available in your time zone and preferred language? Check for self-serve resources and SLAs. |
What Are Content Analytics Software?
Content analytics software is a category of tools designed to track, measure, and report how audiences engage with your digital content. These platforms collect data on views, interactions, and referral sources to reveal what content resonates most.
By surfacing patterns in audience behavior, content analytics software helps teams make informed decisions about content strategy and optimization.
Features
When selecting content analytics software, keep an eye out for the following key features:
- Traffic tracking: Tracks visitors, page views, and sessions to help you understand audience size and identify popular content.
- Engagement metrics: Measures on-page actions like clicks, scrolls, comments, shares, and time spent to highlight what keeps your audience involved.
- Referral reporting: Shows which channels drive visitors to your content, helping you optimize distribution strategies and invest in the right platforms.
- Content performance dashboards: Centralizes critical content metrics in an interactive dashboard so you can monitor performance trends at a glance.
- Segmentation tools: Allows you to filter content data by audience segments, devices, or locations to compare behaviors across different groups.
- Historical analysis: Lets you review and compare performance over time to make seasonal or campaign-level decisions.
- Goal or conversion tracking: Connects content metrics to specific actions like downloads, sign-ups, or purchases, making it easy to tie content to business outcomes.
- Automated reporting: Delivers scheduled or customizable reports to your inbox or stakeholders, saving time on routine updates.
- Export and sharing options: Makes sharing insights simple by allowing you to export charts, reports, or raw data into formats that fit your workflow.
- Data privacy controls: Allows you to manage data retention, consent, and access settings to maintain compliance with privacy requirements and internal policies.
Common Content Analytics Software AI Features
Beyond the standard content analytics software features listed above, many of these solutions are incorporating AI with features like:
- Predictive analytics: Uses AI to forecast future content performance and audience behaviors based on historical trends and emerging patterns.
- Automated trend detection: Scans your analytics data to spot new themes, spikes, or dips in engagement, notifying you about significant shifts without manual monitoring.
- AI-powered content suggestions: Recommends topics, formats, or publication times likely to engage your audience, based on prior successes and broader content trends.
- Natural language sentiment analysis: Analyzes user feedback and comments using NLP to reveal sentiment and content perception at scale.
- Anomaly detection: Flags unusual changes in traffic or engagement metrics, so you can investigate issues or capitalize on unexpected opportunities quickly.
Benefits
Implementing content analytics software provides several benefits for your team and your business. Here are a few you can look forward to:
- Informed content strategy: Access real-time and historical insights to guide your content planning and increase overall impact.
- Audience behavior mapping: Understand who engages with your content and how, using engagement metrics and segmentation tools.
- Performance transparency: Quickly see which content drives visits, conversions, or other goals, thanks to detailed dashboards and conversion tracking.
- Efficient reporting workflows: Automate report creation and sharing, freeing up your team’s time for higher-value work.
- Cross-platform measurement: Unify analytics from web, social, and referral sources to get a complete view of your content’s reach.
- Targeted resource allocation: Reveal which topics or formats deserve further investment, using clear performance and trend data.
- Privacy and compliance control: Rely on data privacy settings and access controls to help meet compliance standards and safeguard your audience’s information.
Costs and Pricing
Selecting content analytics software requires an understanding of the various pricing models and plans available. Costs vary based on features, team size, add-ons, and more. The table below summarizes common plans, their average prices, and typical features included in content analytics software solutions:
Plan Comparison Table for Content Analytics Software
| Plan Type | Average Price | Common Features |
|---|---|---|
| Free Plan | $0 | Basic traffic tracking, limited engagement metrics, standard dashboards, basic export options, and community support. |
| Personal Plan | $10-$30/user/month | Standard analytics reports, custom dashboards, historical analysis, limited goal tracking, and email support. |
| Business Plan | $40-$100/user/month | Advanced segmentation, automated reporting, integration options, team collaboration, premium support, and privacy controls. |
| Enterprise Plan | $120-$300/user/month | Custom data retention, priority support, advanced security, API access, unlimited users, and tailored onboarding. |
Content Analytics Software FAQs
Here are some answers to common questions about content analytics software:
What types of content can content analytics software track?
Content analytics software can track blog posts, landing pages, videos, case studies, whitepapers, and social media content. Some platforms also cover downloadable resources and interactive elements. Make sure to check that your software supports the content types most relevant to your business.
How is content analytics software different from general web analytics tools?
Content analytics software focuses on granular content performance, segmenting data by individual assets, topics, or formats. While general web analytics provides sitewide traffic stats, content analytics tools let you dig into specific pieces, engagement depth, and content-specific conversions.
Can content analytics software integrate with other marketing tools?
Yes, most content analytics platforms integrate with CMS, email marketing, CRM, and social media tools. Integrations let you connect performance analytics with campaign results, automate reporting, and centralize your marketing data for easier insights.
How often is data updated in content analytics software?
Update frequency varies by platform. Some offer real-time or near-real-time updates, while others refresh every few hours or once per day. If you need immediate access to performance data, confirm update intervals during your evaluation.
What security measures should I expect from content analytics software?
Look for end-to-end encryption, role-based access control, audit logs, and options to limit data retention. For teams with compliance needs, ask if the software supports GDPR, CCPA, or other relevant certifications. Proper safeguards help protect both your business and your users.